What is Bottlenecks?
Bottlenecks
It’s an
issue which can degrades the Application Performance.
By Using Monitors we can find the Performance
Bottlenecks.
TheseMonitors
might be App Server Monitors
Web Server Monitors
DB Server Monitors
N/w Monitors
They help finding out the troubled area in
our Scenario which causes increased Response time.
The measurements made are Usually
Performance Response Time, Throughput, Hits/Sec, N/W delay Graphs etc….
How to identify bottlenecks in Performance
Testing?
EXAMPLE
we will see
how to identify the bottleneck issues by comparing Average Transaction Response
Time and Transaction Performance Summary
Consider we have following three transactions
1.
Login
2.
Book Ticket
3.
Logout
Below is the Transaction
Performance Summary graph for the above transactions.In this example, the
average response time for BookTicket transaction is 11
seconds.

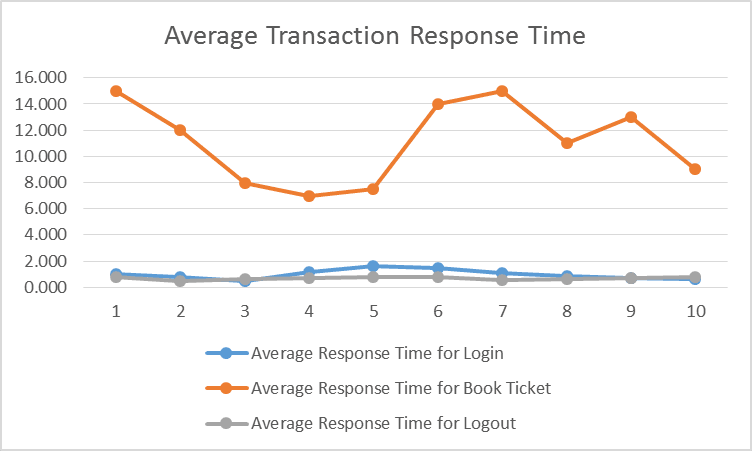
Below is the Average Transaction Response Time
graph which shows Book Ticket transaction’s response time is
very high (15 seconds) at 1st and 7th minute of the scenario.

Our aim is to identify the pinpoint of the
issue and to analyze the root cause of high response time for the Book
Ticket transaction. To achieve above said objective, we need
diagnostics tool, by default HP provides following diagnostics modules:
J2EE/.NET, Siebel, Oracle, SAP R/3.
Now, we will see how to isolate the bottleneck
issue through diagnostics. Prerequisite is Web Page Diagnostic feature should
be enabled before executing the scenario.
Breaking down transactions helps us to
identify the bottleneck issues. Open the Average Transaction Response Time in
Analysis, right-click on it and select Web Page Diagnostics for Book
Ticket.
Web Page Diagnostics displays breakdown of
each page component’s download time of Book Ticket transaction. If
the download time is too long, analyze the which measurements is responsible
for the lengthy download such as FTP Authentication, DNS Resolution Time, Time
to Buffer, Handshaking time etc. If you suspect, there should be any server
related problem, check the First Buffer Breakdown option.
It is ideal to check the Network Monitor
graphs; it helps to determine what network problem caused the bottlenecks. Also
we can identify the bottleneck by using auto-correlating feature. Right-click
on Average Transaction Response Time and select Auto Correlate. Mention the
time frame for analysis, and the correlate options (which data that you want to
correlate) such as SQL Server, Windows Resources, and Web Logic (JMX) etc.
Web Logic (JMX) or JVM Heap Size or Private
Bytes might be the cause of slow performance of Book Ticket transaction.
In this way we can pinpoint the issues by
analyzing Average Transaction Response Time graph. There are other ways too to
determine the cause. In next blog post, we will see about Network and Server
Problems.


No comments:
Post a Comment